Performance Tuning
Almost every "slow database" that reaches us is not a slow database: it is a query with no index, an ORM issuing three hundred queries per request, or a working set that stopped fitting in memory. Swapping the server for a bigger one hides the problem for a few months and hands back the same bill later.
The method is always the same: measure, find the few queries that account for most of the time, fix the cause, measure again.
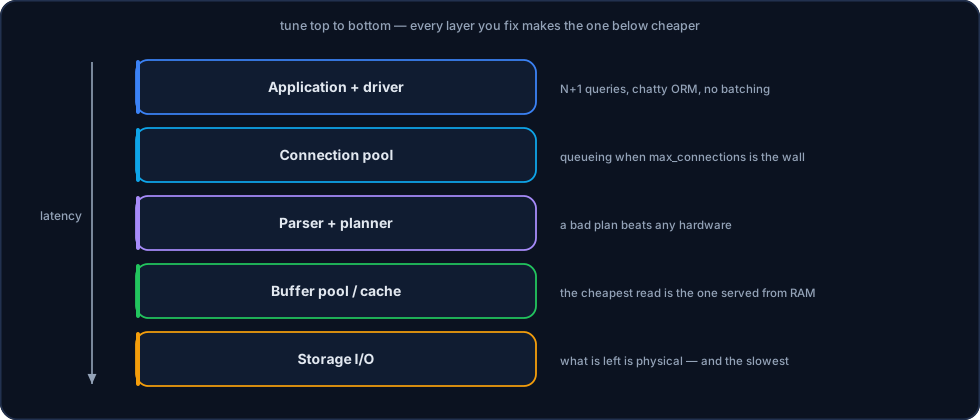
Order matters: fixing one layer makes the one below cheaper. The reverse path doesn't work.
1. Measure before touching anything
Without numbers, tuning is guessing.
| Source | What it reveals |
|---|---|
pg_stat_statements (PostgreSQL) | Queries by total accumulated time — the ranking that matters |
performance_schema / slow query log (MySQL) | Slow queries and the ones executed very often |
| System metrics | CPU, I/O latency, memory, active connections |
| Replication metrics | Lag, which exposes heavy writes or an undersized replica |
| Application tracing | Where the request spends time: database, network, or the code itself |
Total time beats individual time
A 2-second query run 10 times a day matters less than a 20 ms query run 200,000 times. Sort by total accumulated time, not by the slowest single query.
2. The application: the cheapest place to fix
- N+1 — one query to list, plus one per item. It is the most common pattern and the highest payoff: solved with a
JOINor batch loading. SELECT *— pulls columns nobody uses, prevents covering indexes and inflates the network.- Deep
OFFSETpagination —OFFSET 100000makes the database scan and discard 100,000 rows. Keyset pagination has no such cost. - No batching — a thousand individual
INSERTs cost far more than oneINSERTwith a thousand rows. - Long transactions — hold resources, delay cleanup of old row versions and increase replica lag.
3. Execution plans
Reading the plan is what separates a fix from a guess.
-- PostgreSQL: with real time and pages read, not just the estimate
EXPLAIN (ANALYZE, BUFFERS) SELECT ... ;

-- MySQL
EXPLAIN ANALYZE SELECT ... ;
What to look for:
- Sequential scan on a large table — a missing index, or an index that exists and cannot be used (function over the column, type mismatch,
LIKE '%something'). - Estimate far from reality — stale statistics. Run
ANALYZEbefore concluding anything else. - Sort spilling to disk — not enough working memory for the
ORDER BY/GROUP BY. - Wrong join method — almost always a consequence of a bad estimate, not of the planner.
4. Indexes
A good index fixes things; too many indexes cost you on every write.
- Composite index in the right order — equality columns first, range last. An index on
(customer_id, created_at)serves both the per-customer query and the customer + period one; the reverse does not. - Covering index — when the index holds every column the query needs, the database never touches the table.
- Partial index — on PostgreSQL, indexing only the rows that matter (
WHERE status = 'active') cuts size and maintenance cost. - Unused indexes are a loss — they take disk, make every
INSERTmore expensive and inflate the backup. The database's usage statistics show which ones have never been read. - Duplicate index —
(a)is redundant when(a, b)exists.
5. Memory and cache
| Engine | Central parameter | Starting rule |
|---|---|---|
| MySQL / InnoDB | innodb_buffer_pool_size | ~60–70% of RAM on a dedicated server |
| PostgreSQL | shared_buffers + OS cache | ~25% in shared_buffers, counting on the system cache |
| PostgreSQL | work_mem | Per sort operation — careful: it multiplies per connection |
| ClickHouse | Per-query memory limit | Keeps one aggregation from taking the node down |
The signal to watch is the cache hit ratio. When it falls in a sustained way, the working set has grown beyond RAM — and the next step is memory or partitioning, not another index.
6. Connections
Databases don't like thousands of connections. Each one consumes memory and competes for CPU.
- Pooling is mandatory — PgBouncer on PostgreSQL, ProxySQL on MySQL, or the framework's own pool, properly configured.
- Fewer connections, more throughput — past a certain point, growing the pool makes performance worse: the queue moves from the pool into the database, where it is more expensive.
- Split reads from writes — sending reads to replicas relieves the primary and is the most direct way to scale reads.
7. Storage and I/O
What is left after all of the above is physical:
- volume write latency, especially for the transaction log;
- available IOPS against what the peak demands;
- separation between the data volume and the log volume;
- compression, which trades CPU for I/O — almost always a good deal on analytical workloads.
Typical gains
| Fix | Observed gain |
|---|---|
| Missing index on a high-frequency query | 10× to 1000× on the query |
| Eliminating N+1 | 5× to 50× on request latency |
| Buffer pool sized for the working set | 2× to 20× on read workloads |
| Corrected connection pool | Error spikes end and latency becomes stable |
| Reads routed to a replica | Relief proportional to the read volume |
A bigger server is the last option, not the first
Growing the hardware before looking at an execution plan solves things for a while and charges you later — with a larger bill and the same problem.
Related Pages
- Administration — Periodic slow query review
- Replication — Scaling reads without overloading the primary
- Multi-Region MySQL · Multi-Region PostgreSQL — When latency is network, not database
- ClickHouse High Availability — Analytical load separated from OLTP
- Installation — Sizing that avoids half of these problems